My Server Went Down and I Found Out Five Hours Later by Accident
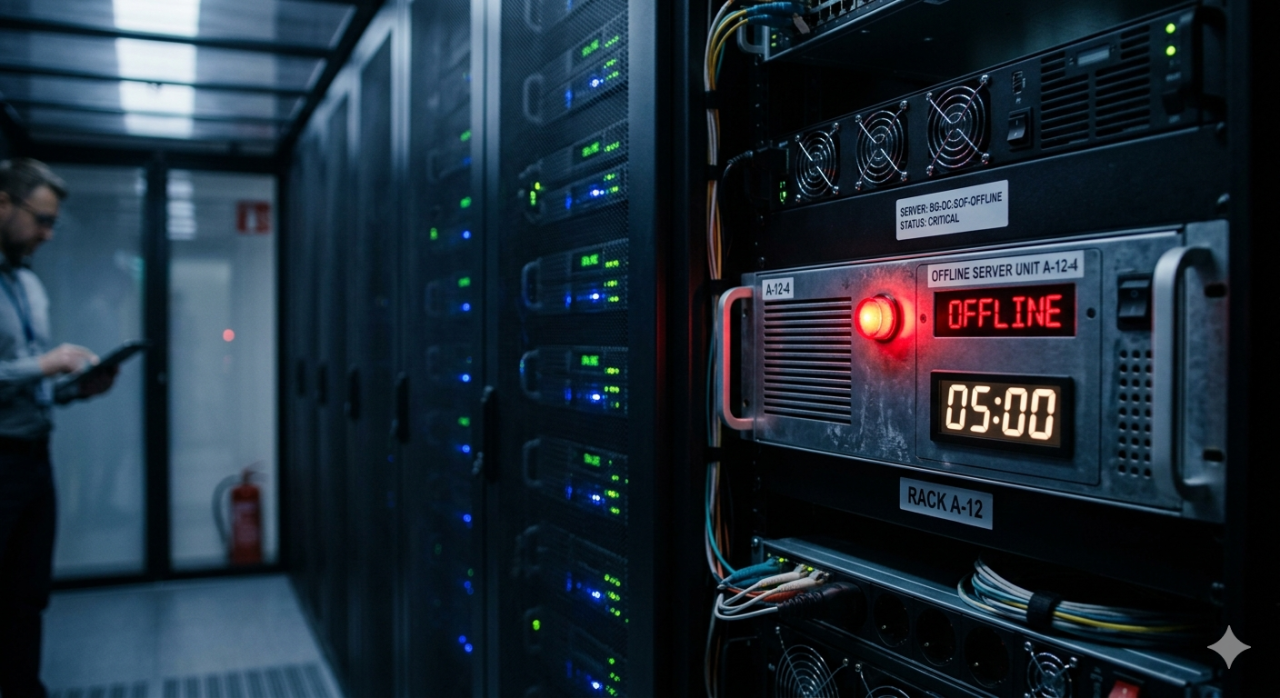
The notification did not come from a monitoring service. It did not come from an automated alert or a webhook firing into Slack. It came from the most primitive monitoring system imaginable: opening a browser, typing the URL, and staring at a blank page. It was a Tuesday afternoon. The site had been down since sometime around nine in the morning, and it was now well past two in the afternoon. Five hours of total silence from a web application that normally served thousands of requests per day. Five hours during which every visitor saw an error page, every API call returned nothing, and every scheduled task failed quietly in the background. The server had not crashed dramatically. There was no kernel panic, no disk failure, no attack vector that left forensic evidence. The Contabo VPS had simply stopped responding to HTTP requests, sitting there with a valid IP address and a heartbeat on the network layer, but refusing to serve any web traffic at all.
The discovery happened because of a completely unrelated task. There was a need to check a specific page layout for a design change, so the browser went to the URL and returned nothing. The first instinct was to blame the local network. Refreshed the page. Still nothing. Tried a different browser. Still nothing. Opened the terminal and pinged the server. Packets returned normally. SSH connection? Working fine. Apache status? Dead. The web server process had crashed at some point during the early morning hours and never restarted, because there was no process supervisor configured to handle that exact failure mode. The fix took thirty seconds. The realization that this could happen again, and probably had happened before without anyone noticing, took considerably longer to digest.
Every developer who has run production services on a VPS has a version of this story. Maybe it was not five hours. Maybe it was two, or eight, or a full weekend. The specifics vary but the pattern is identical. The server went down, nobody noticed, and the discovery was accidental. The root problem is not server reliability. Servers fail, processes crash, disks fill up, memory leaks accumulate. That is the nature of running software on physical hardware. The root problem is the absence of monitoring, and more specifically, the gap between knowing the server is online and knowing the application is actually working.
The Difference Between Uptime Monitoring and Knowing Your Site Actually Works
Traditional uptime monitors do one thing well. They send an HTTP request to a URL at regular intervals and check whether the response code is 200. If the code is anything else, or if the request times out, an alert fires. This catches the most catastrophic failures: the server is completely unreachable, the domain has expired, the SSL certificate is invalid. But it misses an enormous category of problems that are arguably more common and more damaging.
Consider a scenario where the server returns a 200 status code, but the page is broken. The database connection failed, so the content area shows an error message instead of the expected product listing. The CSS file failed to load, so the page renders as unstyled HTML. A JavaScript error prevents the main application from initializing, leaving the user staring at a loading spinner that never resolves. A third party widget injects an overlay that covers the entire page content. In all of these cases, the uptime monitor reports everything as healthy because it received a 200 response. The server is up. The site is broken. Nobody knows.
This gap between "the server responds" and "the site works" is where screenshot monitoring becomes essential. A scheduled screenshot captures what the page actually looks like at regular intervals. If the page suddenly shows an error message, a broken layout, or a blank white screen, the screenshot makes that immediately visible. Combine scheduled screenshots with pixel diff comparison, and the system can automatically detect when a page has changed in unexpected ways. A few pixels shifting because of a content update is normal. The entire page turning white or displaying an error stack trace is not, and the diff algorithm can distinguish between the two with configurable sensitivity thresholds.
After the five hour outage, the first thing that got set up was an uptime monitor for every critical service. But the more interesting addition was scheduled screenshot monitoring that captures the actual visual state of key pages every fifteen minutes. The uptime monitor catches the obvious crashes. The screenshot monitor catches everything else: the subtle failures that return a 200 status code while showing a broken page, the third party scripts that inject unexpected content, the database errors that surface only under specific conditions.
Building the Alert Pipeline That Should Have Existed From Day One
The architecture of a proper monitoring system is not complicated in theory. A scheduler triggers a check at defined intervals. The check captures the current state of the target. The state is compared against the expected baseline. If the comparison exceeds a threshold, an alert fires. The challenge is not in the architecture but in the reliability of each component. A monitoring system that itself goes down is worse than no monitoring at all, because it creates a false sense of security.
The screenshot monitoring pipeline works in stages. The scheduler dispatches a capture job at the configured interval, typically every five, ten, or fifteen minutes depending on the criticality of the page. The capture job runs a headless Chromium instance that loads the page, waits for rendering to complete, and saves the resulting screenshot. The new screenshot is then compared against the previous capture using a pixel diff algorithm that identifies changed regions and calculates the total percentage of change. If the change exceeds the configured threshold, a notification is dispatched through the configured channels: email, webhook, Slack, or any custom endpoint.
The diff comparison is where things get genuinely interesting from a technical perspective. A naive pixel comparison would flag every screenshot as changed because of dynamic content like timestamps, advertisements, or animated elements. The diff engine accounts for this by supporting exclusion zones, rectangular regions of the page that are masked out before comparison. The timestamp in the header, the rotating banner ad, the live chat widget in the corner: these can all be excluded so that only meaningful changes trigger alerts. What remains after exclusion is the stable content area, and any changes there are almost certainly worth investigating.
The five hour outage would have been caught within minutes under this system. The first scheduled screenshot after the server went down would have returned either a blank image or an error page, both of which would have differed dramatically from the baseline. The diff percentage would have been near 100%, far above any reasonable threshold, and the alert would have fired immediately. Five hours of downtime would have been five minutes, and those five minutes would have been the monitoring interval itself, not the time it took for a human to accidentally stumble upon the problem.
What Five Hours of Invisible Downtime Actually Costs
The immediate cost of five hours of downtime is easy to calculate when the numbers are available. For a site handling thousands of daily requests, five hours represents a significant slice of daily traffic. Every request that returned an error was a user who did not get what they came for. Some of those users were new visitors who would never return. Some were existing users who would lose a small amount of trust. Some were API consumers whose own applications failed because of the dependency. The direct revenue impact depends on the nature of the site, but even for a small SaaS application, five hours of downtime during business hours can easily represent hundreds of dollars in lost conversions.
The hidden cost is harder to quantify but arguably larger. Search engines that crawled the site during those five hours received error responses, and while a brief outage is generally tolerated by Google's crawling infrastructure, extended downtime can result in temporary deindexing of affected pages. Email campaigns that were running during the outage drove traffic to a dead endpoint, wasting the entire campaign spend. Scheduled tasks that depend on the web application, things like webhook deliveries, report generation, and batch processing, all failed silently and needed to be identified and rerun manually after the server was restored.
The most insidious cost is the reputational one. Users who encounter a down site do not typically send an email saying "your site is down." They simply leave and may or may not come back. There is no feedback mechanism for downtime because the feedback mechanism itself is down. The five hour window was long enough that some users almost certainly tried the site, found it broken, and moved to a competitor without ever generating a single data point that would indicate what happened. They are simply gone, and there is no way to know how many or who they were.
From Reactive to Proactive and Never Finding Out by Accident Again
The lesson from that Tuesday afternoon was not that servers crash. That was already known. The lesson was that every minute between a failure and its discovery is a minute of compounding damage, and the only way to minimize that window is to automate the detection. Human monitoring does not scale. Checking a site manually once a day means the average detection time for an outage is twelve hours. Checking it once an hour brings that to thirty minutes, but no human can realistically check every page of every application once an hour around the clock.
The combination of uptime monitoring and visual screenshot monitoring covers both layers of the problem. The uptime monitor catches the server going completely offline. The screenshot monitor catches the application breaking while the server stays up. Together, they reduce the detection window from "whenever someone happens to notice" to the monitoring interval itself, which can be as short as one minute for critical services. The alert fires, the notification arrives, and the fix begins within minutes instead of hours.
The server has gone down twice more since that original incident. Both times, the alert arrived within three minutes. Both times, the fix was applied before any significant traffic was lost. The monitoring infrastructure paid for itself with the very first incident it caught, and everything after that has been pure upside. The era of finding out about outages by accident is over, and looking back, the only real question is why it took a five hour outage to make the investment obvious.
Frequently Asked Questions
What is the difference between uptime monitoring and screenshot monitoring?
Uptime monitoring checks whether a server returns a valid HTTP response code, typically 200. Screenshot monitoring captures the actual visual appearance of the page and compares it against a baseline. A server can return a 200 status code while displaying a broken page, which uptime monitoring would miss but screenshot monitoring would catch.
How often should screenshots be taken for monitoring purposes?
The interval depends on the criticality of the page. Mission critical pages like checkout flows and login screens benefit from one to five minute intervals. Content pages and marketing sites can often use fifteen to thirty minute intervals. The trade-off is between detection speed and the computational cost of frequent captures.
Can screenshot monitoring detect problems that are not full outages?
Yes. Screenshot monitoring detects any visual change to the page, including broken layouts, missing images, error messages displayed within an otherwise functional page, third party script injections, and CSS loading failures. These partial failures are often invisible to traditional uptime monitors.
What is pixel diff comparison and how does it work?
Pixel diff compares two screenshots at the pixel level to identify regions that have changed. The algorithm calculates the total percentage of changed pixels and can highlight the specific areas where differences exist. Configurable sensitivity thresholds and exclusion zones prevent false alerts from dynamic content like ads or timestamps.
How quickly can the monitoring system alert me when something goes wrong?
The alert speed depends on the monitoring interval. With a one minute interval, the maximum detection time is one minute plus the time to capture and compare the screenshot, which typically adds two to five seconds. Notifications can be delivered via email, Slack webhooks, or custom HTTP endpoints within seconds of detection.
Does screenshot monitoring work for single page applications that rely heavily on JavaScript?
Yes. The screenshots are captured using a real Chromium browser engine that fully executes JavaScript, renders dynamic content, and waits for the page to reach a stable state before capturing. This means single page applications built with React, Vue, Angular, or similar frameworks are captured accurately.